

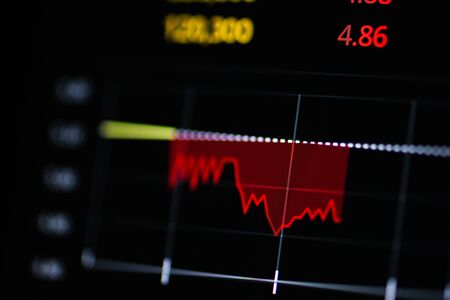
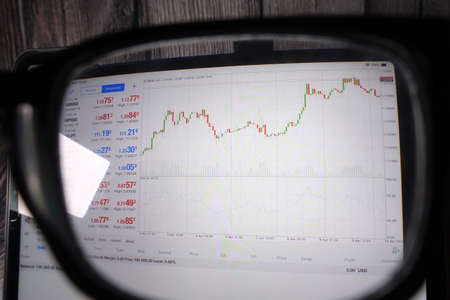
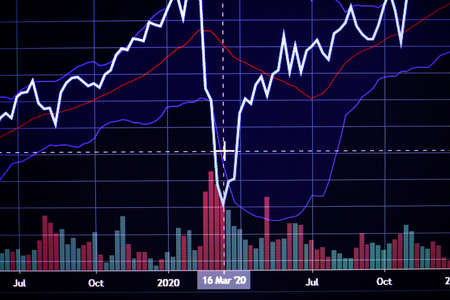
Shallow depth of field (selective focus) with details of a chart showing the stock market crash from March 2020 due to the Covid-19 pandemic on a computer screen (S&P500 index)
Коллекция по умолчанию
Коллекция по умолчанию
Создать новую

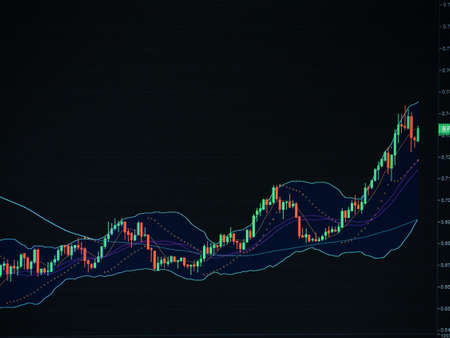
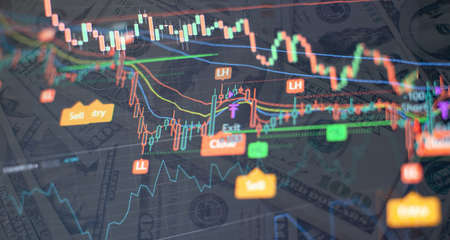
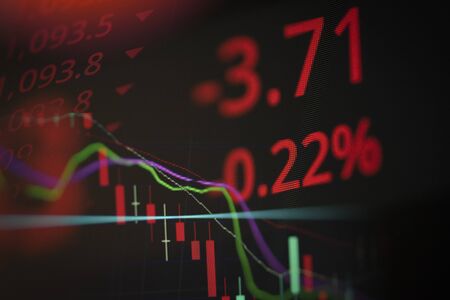
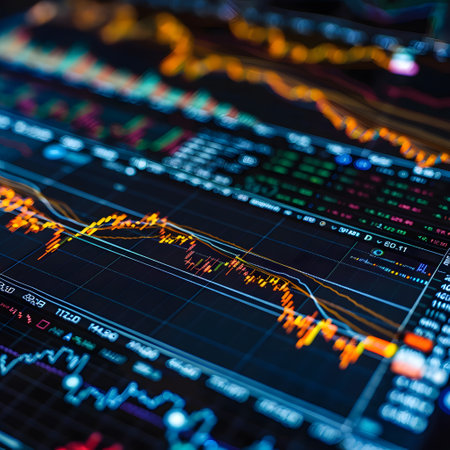
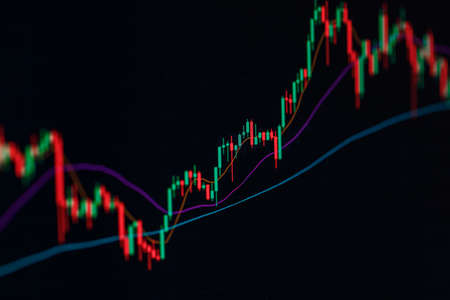
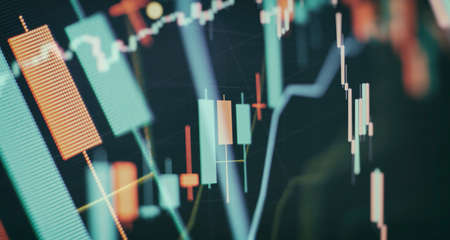
Financial instruments with various types of indicators including volume analysis for professional technical analysis
Коллекция по умолчанию
Коллекция по умолчанию
Создать новую

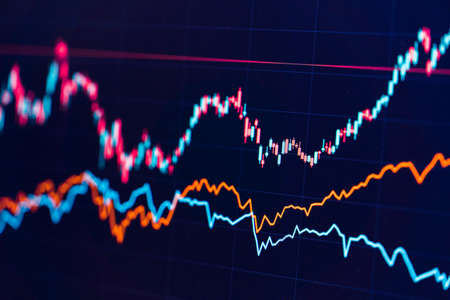
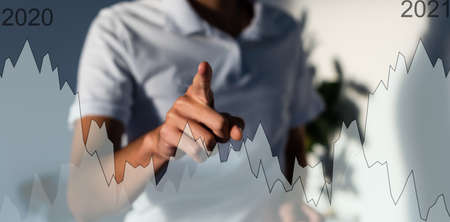
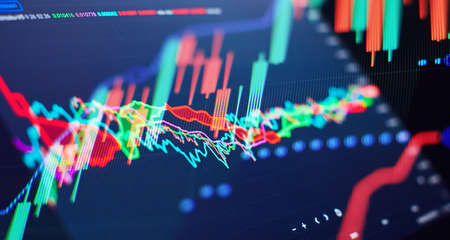
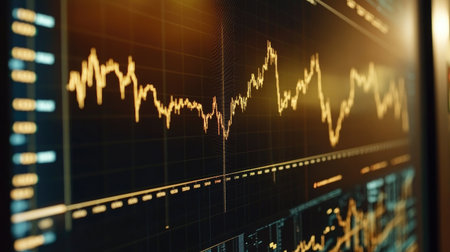
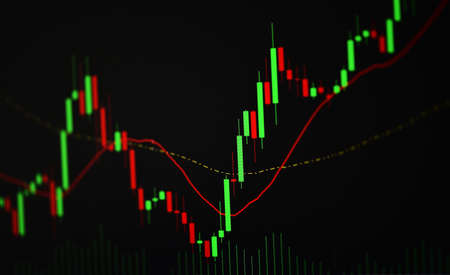
Business financial or stock market background. Business graph on stock market financial exchange
Коллекция по умолчанию
Коллекция по умолчанию
Создать новую

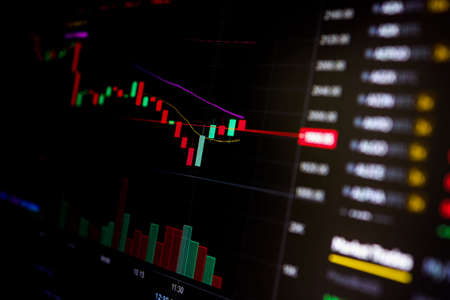
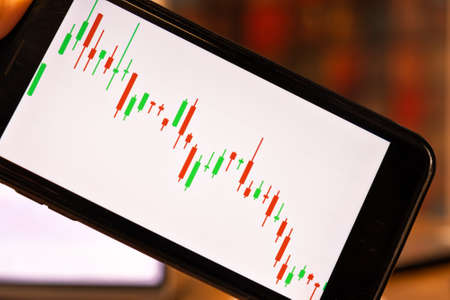
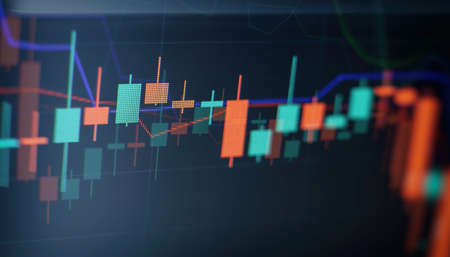
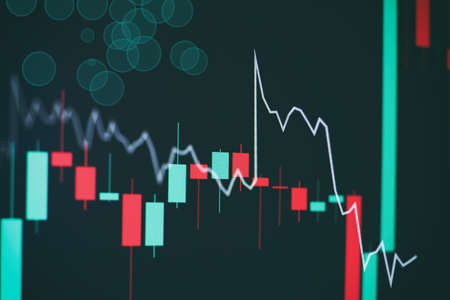
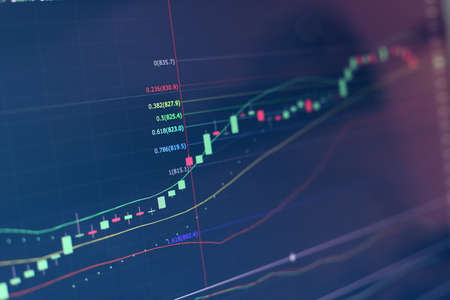
Financial stock market graph. Stock Exchange. Selective focus.
Коллекция по умолчанию
Коллекция по умолчанию
Создать новую
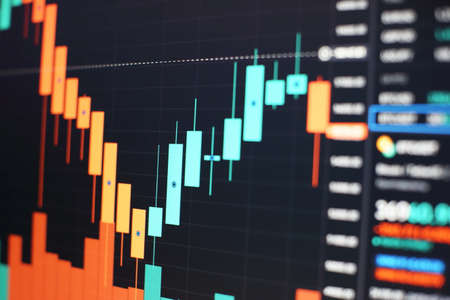
Business or Financial Reference: Displaying stock market data, stock exchange or chart on a monitor, stock market chart, stock exchange or chart. stock market investment trading chart.
Коллекция по умолчанию
Коллекция по умолчанию
Создать новую

Business chart with line graph, bar chart and numbers on dark background, 3d rendering. Computer digital drawing.
Коллекция по умолчанию
Коллекция по умолчанию
Создать новую

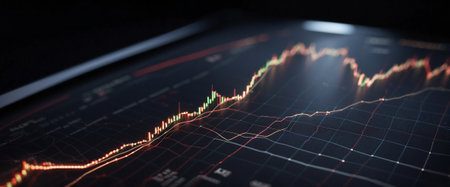
A stock market graph on a black background.
Коллекция по умолчанию
Коллекция по умолчанию
Создать новую
Financial stock market graph. Stock Exchange. Selective focus.
Коллекция по умолчанию
Коллекция по умолчанию
Создать новую

Analyzing financial statistics and analyzing a market data. Data analysis from charts and graphs
Коллекция по умолчанию
Коллекция по умолчанию
Создать новую

Financial stock market graph. Stock Exchange. Selective focus.
Коллекция по умолчанию
Коллекция по умолчанию
Создать новую

Stock market candlestick chart, asset prices movement, currency exchange price action simple concept. Computer screen, display, candle chart, graph detail, extreme closeup, nobody, no people
Коллекция по умолчанию
Коллекция по умолчанию
Создать новую

image of the financial graph on a computer monitor.
Коллекция по умолчанию
Коллекция по умолчанию
Создать новую

Indicators including volume analysis for professional technical analysis on the monitor of a computer. Fundamental and technical analysis concept.
Коллекция по умолчанию
Коллекция по умолчанию
Создать новую

Abstract candlestick chart on white digital screen. Stock market or crypto data chart, graph with rectangular grid on light background.
Коллекция по умолчанию
Коллекция по умолчанию
Создать новую
Stock exchange, cryptocurrency price chart on a screen. Candlestick chart, btc. Online currency exchange market. Trading, bidding. Tracking the cryptocurrency rate. 4K. Close up.
Коллекция по умолчанию
Коллекция по умолчанию
Создать новую
Stock exchange market chart background. Candle stick graph chart with indicator.
Коллекция по умолчанию
Коллекция по умолчанию
Создать новую

Financial stock market graph. Stock Exchange. Selective focus.
Коллекция по умолчанию
Коллекция по умолчанию
Создать новую
View of Stock Market Crash from Covid-19 Pandemic with shallow depth of field.
Коллекция по умолчанию
Коллекция по умолчанию
Создать новую
price graph and indicator, red and green candlestick chart on blue theme screen, market volatility, up and down trend. Stock trading, cryptocurrencies background.
Коллекция по умолчанию
Коллекция по умолчанию
Создать новую

Fundamental and technical analysis concept.
Коллекция по умолчанию
Коллекция по умолчанию
Создать новую

Online stock exchange application with information on screen, closeup
Коллекция по умолчанию
Коллекция по умолчанию
Создать новую

Trader investor broker holding finger using cell phone app executing financial stock trade market trading order to buy or sell
Коллекция по умолчанию
Коллекция по умолчанию
Создать новую
businessman hand working with virtual chart business on touch screen computer as concept
Коллекция по умолчанию
Коллекция по умолчанию
Создать новую

Candle stick graph chart of stock market investment trading. The Forex chart on the digital screen. Bar graphs, Diagrams, financial figures. Forex chart.
Коллекция по умолчанию
Коллекция по умолчанию
Создать новую
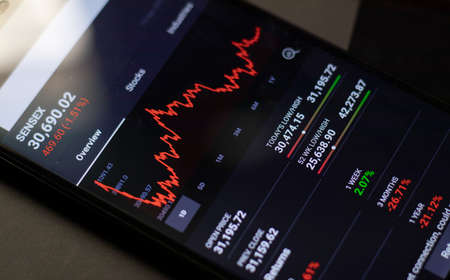
Maski, India - April 14, 2020 : Crash in sensex share market on mobile during covid-19 lockdown.
Коллекция по умолчанию
Коллекция по умолчанию
Создать новую

Business and Economy Theme. Trading Cryptocurrencies. Stock Market Candles Chart on Computer Display Close Up.
Коллекция по умолчанию
Коллекция по умолчанию
Создать новую
Financial chart with pen, stock analysis data for business background on digital screen. Graphs of the growth of the financial market forex. trading candlestick chart
Коллекция по умолчанию
Коллекция по умолчанию
Создать новую

The Stock Exchange, Streaming Trade Screen, The stock screen shows a list of stocks with reduced value.
Коллекция по умолчанию
Коллекция по умолчанию
Создать новую
Stock market or forex trading graph in futuristic concept with copyspace
Коллекция по умолчанию
Коллекция по умолчанию
Создать новую

Stock exchange trading analysis investment financial on display crisis stock crash down and grow up gain and profits financial impact or forex graph Stock market digital graph chart business indicator
Коллекция по умолчанию
Коллекция по умолчанию
Создать новую
The Forex graph chart on the digital screen. Working set for analyzing financial statistics and analyzing a market data.
Коллекция по умолчанию
Коллекция по умолчанию
Создать новую

indicators including volume analysis for professional technical analysis on the monitor of a computer. Fundamental and technical analysis concept.
Коллекция по умолчанию
Коллекция по умолчанию
Создать новую
market analyze. Bar graphs, Diagrams, financial figures. Abstract glowing forex chart interface wallpaper. Investment, trade, stock, finance
Коллекция по умолчанию
Коллекция по умолчанию
Создать новую
asset allocation concept graph on blackboard
Коллекция по умолчанию
Коллекция по умолчанию
Создать новую
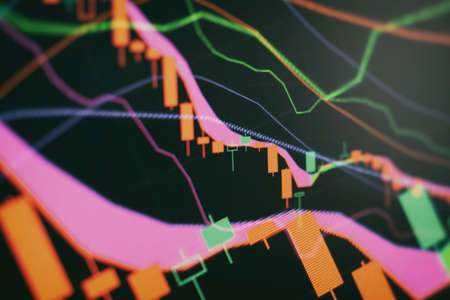
Technical price graph and indicator, red and green candlestick chart on blue theme screen, market volatility, up and down trend. Stock trading, cryptocurrencies background.
Коллекция по умолчанию
Коллекция по умолчанию
Создать новую
Financial statistics, stock exchange prices summarized in candle stick chart.
Коллекция по умолчанию
Коллекция по умолчанию
Создать новую
A live stock market billboard with gains and losses curves
Коллекция по умолчанию
Коллекция по умолчанию
Создать новую
Charts of financial instruments with various types of indicators including volume analysis for professional technical analysis on the monitor of a computer.
Коллекция по умолчанию
Коллекция по умолчанию
Создать новую
A stock investor shows another investor the behavior of a stock on the stock market on the monitor. Concept economy, stock market.
Коллекция по умолчанию
Коллекция по умолчанию
Создать новую

Stockmarket online trading chart candlestick on crypto currency platform. Stock exchange financial market price candles graph data pattern analysis concept. Computer screen closeup background
Коллекция по умолчанию
Коллекция по умолчанию
Создать новую

Shallow depth of field (selective focus) with details of a candlestick chart on a computer screen.
Коллекция по умолчанию
Коллекция по умолчанию
Создать новую

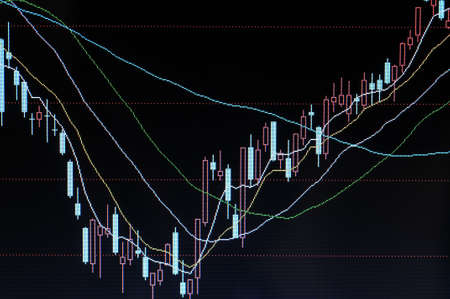
Candle stick graph chart with indicator showing bullish point or bearish point, up trend or down trend of price of stock market or stock exchange trading, investment and financial concept.
Коллекция по умолчанию
Коллекция по умолчанию
Создать новую
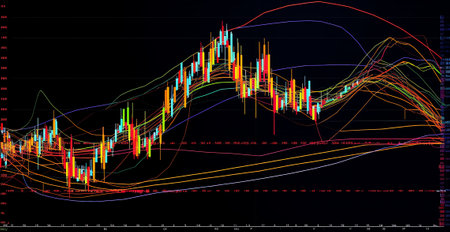
Stock Market Chart on Dark Background: Financial Analytics. Digital Art: Modern Technologies
Коллекция по умолчанию
Коллекция по умолчанию
Создать новую

Stock market or forex trading graph in graphic concept suitable for financial investment or Economic trends business idea and all art work design.
Коллекция по умолчанию
Коллекция по умолчанию
Создать новую
Professional market analysis. Office monitor background. Busines analysing stock market data on a monitor.
Коллекция по умолчанию
Коллекция по умолчанию
Создать новую
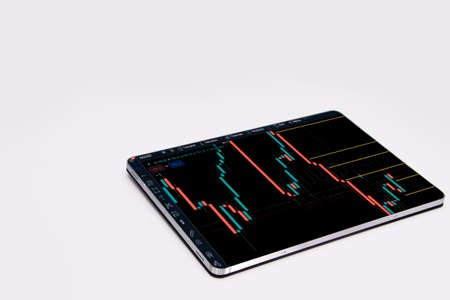
Trading forex with METATRADER 4 on Apple iPad Pro 11 inch. iPad Pro is the most user friendly which good for people on the go.
Коллекция по умолчанию
Коллекция по умолчанию
Создать новую

analysis for professional technical analysis on the monitor of a computer.
Коллекция по умолчанию
Коллекция по умолчанию
Создать новую

forex trading graph and candlestick chart suitable for financial investment concept. Economy trends background for business idea and all art work design. Abstract finance background.
Коллекция по умолчанию
Коллекция по умолчанию
Создать новую
Stock market exchange loss trading graph analysis investment indicator business graph charts of financial board display candlestick double exposure crisis stock crash red price chart fall money
Коллекция по умолчанию
Коллекция по умолчанию
Создать новую

Investment, trade, stock, finance and analysis , Economic graph with diagrams on the stock market, for business and financial concepts
Коллекция по умолчанию
Коллекция по умолчанию
Создать новую

Abstract glowing forex chart interface wallpaper. Investment, trade, stock, finance and analysis concept.
Коллекция по умолчанию
Коллекция по умолчанию
Создать новую
forex trading graph and candlestick chart suitable for financial investment concept. Economy trends background for business idea and all art work design. Abstract finance background.
Коллекция по умолчанию
Коллекция по умолчанию
Создать новую
Close up n hand holding smart phone with candle graph for trade stock market investment crypto currency
Коллекция по умолчанию
Коллекция по умолчанию
Создать новую
market analyze. Bar graphs, Diagrams, financial figures. Abstract glowing forex chart interface wallpaper. Investment, trade, stock, finance
Коллекция по умолчанию
Коллекция по умолчанию
Создать новую
Technical price graph and indicator, red and green candlestick chart on blue theme screen, market volatility, up and down trend. Stock trading, crypto currency background.
Коллекция по умолчанию
Коллекция по умолчанию
Создать новую

financial instruments with various type of indicators including volume analysis for professional technical analysis on the monitor of a computer. Fundamental and technical analysis concept.
Коллекция по умолчанию
Коллекция по умолчанию
Создать новую

Vibrant candlestick patterns and descending trend lines illustrate a market downturn, highlighting analysis tools amid a somber financial atmosphere.
Коллекция по умолчанию
Коллекция по умолчанию
Создать новую
Sustainable portfolio management, long term wealth management with risk diversification concept. Candle stick graph chart of stock market investment trading.
Коллекция по умолчанию
Коллекция по умолчанию
Создать новую

Stock market data.Online trading,investing platform on the computer screen.Blurred background.
Коллекция по умолчанию
Коллекция по умолчанию
Создать новую

The business plan at the meeting and analyze financial numbers to view the performance of the company.
Коллекция по умолчанию
Коллекция по умолчанию
Создать новую

Financial data on a monitor,Stock market data on LED display concept
Коллекция по умолчанию
Коллекция по умолчанию
Создать новую
Grow Stock market trading graph in graphic concept.financial investment or economic trends business design. Abstract finance background.Low angle shot.
Коллекция по умолчанию
Коллекция по умолчанию
Создать новую
stock trade graph candlestick financial investment trade, Forex graph business or Trading crypto currency technical price with indicator on chart screen trend
Коллекция по умолчанию
Коллекция по умолчанию
Создать новую
Sustainable portfolio management, long term wealth management with risk diversification concept.
Коллекция по умолчанию
Коллекция по умолчанию
Создать новую
Working set for analyzing financial statistics and analyzing a market data. Data analysis from charts and graphs
Коллекция по умолчанию
Коллекция по умолчанию
Создать новую

Sales profit numbers changing on monitor after global trade, real time exchange market stocks statistics growing. Financial graphs showing money trend, risk buying. Close up. Tripod shot.
Коллекция по умолчанию
Коллекция по умолчанию
Создать новую
Analysis business accounting on info sheets. Businessman hand working on analyzing investment charts for Gold market, Forex market and Trading market.
Коллекция по умолчанию
Коллекция по умолчанию
Создать новую

Volume analysis for professional technical analysis on the monitor of a computer. Fundamental and technical analysis concept.
Коллекция по умолчанию
Коллекция по умолчанию
Создать новую
Stock market data investment
Коллекция по умолчанию
Коллекция по умолчанию
Создать новую

graph of financial growth on a computer monitor.
Коллекция по умолчанию
Коллекция по умолчанию
Создать новую
Stock market graph and business. Stock or business market analysis concept.
Коллекция по умолчанию
Коллекция по умолчанию
Создать новую

market trading which including of Corporate, Fix income, Bond valuation, Government bond, Secularization and Municipal. Wealth management with risk diversification concept.
Коллекция по умолчанию
Коллекция по умолчанию
Создать новую
Abstract finance crisis curve purple,veri peri color background.Investment, marketing concept.Blurred background.Crisis business finance curve stock concept.Banner.
Коллекция по умолчанию
Коллекция по умолчанию
Создать новую
Business and trading finance contept. Stock exchange market chart view on smart phone screen.
Коллекция по умолчанию
Коллекция по умолчанию
Создать новую
Background of Stock market graph chart on LED display. Trading concept
Коллекция по умолчанию
Коллекция по умолчанию
Создать новую

Financial stock market graph. Stock Exchange. Selective focus.
Коллекция по умолчанию
Коллекция по умолчанию
Создать новую

Virus pandemic covid-19 map on pc screen, global infection, internet.
Коллекция по умолчанию
Коллекция по умолчанию
Создать новую
Indicators including volume analysis for professional technical analysis on the monitor of a computer. Fundamental and technical analysis concept.
Коллекция по умолчанию
Коллекция по умолчанию
Создать новую
graph of financial growth on a computer monitor. cryptocurrency.
Коллекция по умолчанию
Коллекция по умолчанию
Создать новую
Business and trading finance contept. Stock exchange market chart view on smart phone screen.
Коллекция по умолчанию
Коллекция по умолчанию
Создать новую
Computer screen displaying colorful graphs and various electronic equipment
Коллекция по умолчанию
Коллекция по умолчанию
Создать новую
Shallow depth of field (selective focus) with details of a chart showing the stock market crash from March 2020 due to the Covid-19 pandemic on a computer screen (S&P500 index)
Коллекция по умолчанию
Коллекция по умолчанию
Создать новую

Stock market data graph
Коллекция по умолчанию
Коллекция по умолчанию
Создать новую

Analysis business accounting on info sheets. Businessman hand working on analyzing investment charts for Gold market, Forex market and Trading market.
Коллекция по умолчанию
Коллекция по умолчанию
Создать новую
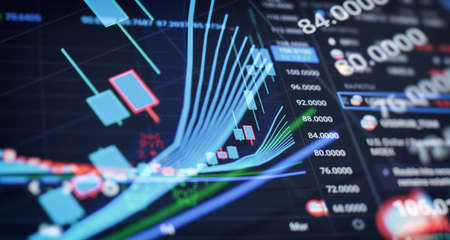
A vibrant image of a large monitor displaying a detailed gold price chart with various technical indicators and a prominent upward trend in gold prices.
Коллекция по умолчанию
Коллекция по умолчанию
Создать новую
Analysis for professional technical analysis on the monitor of a computer. Fundamental and technical analysis concept.
Коллекция по умолчанию
Коллекция по умолчанию
Создать новую
Tablet Index, Exchange Trading Forex Finance Graphic Concept
Коллекция по умолчанию
Коллекция по умолчанию
Создать новую

Data analyzing in Forex, Commodities, Equities, Fixed Income and Emerging Markets: the charts and summary info show about Business statistics and Analytics value - Wealth management concept.
Коллекция по умолчанию
Коллекция по умолчанию
Создать новую
Stockmarket online trading chart candlestick on crypto currency platform. Stock exchange financial market price candles graph data pattern analysis concept. Computer screen closeup background
Коллекция по умолчанию
Коллекция по умолчанию
Создать новую
Business candle stick graph chart of stock market investment trading on background design / Trend of stock market graph exchange financial economy concept
Коллекция по умолчанию
Коллекция по умолчанию
Создать новую

market analyze. Bar graphs, Diagrams, financial figures. Abstract glowing forex chart interface wallpaper. Investment, trade, stock, finance
Коллекция по умолчанию
Коллекция по умолчанию
Создать новую

Financial accounting of profit summary graphs analysis.
Коллекция по умолчанию
Коллекция по умолчанию
Создать новую

Business success and growth concept. Stock market business graph chart on digital screen. Forex market, Gold market and Crude oil market.
Коллекция по умолчанию
Коллекция по умолчанию
Создать новую
Sustainable portfolio management, long term wealth management with risk diversification concept.
Коллекция по умолчанию
Коллекция по умолчанию
Создать новую
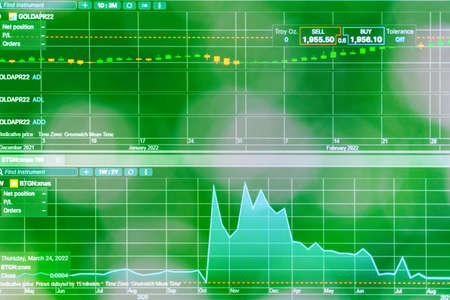
Daily trading prices stock market graph showing on the screen.Daily investor's business everyday life.Selective focus.Telsiai,Lithuania.03-26-2022
Коллекция по умолчанию
Коллекция по умолчанию
Создать новую

Financial stock market graph. Stock Exchange. Selective focus.
Коллекция по умолчанию
Коллекция по умолчанию
Создать новую
The Stock Exchange, Streaming Trade Screen, The stock screen Show the stock price rise.
Коллекция по умолчанию
Коллекция по умолчанию
Создать новую
Stock growth chart. Rising market: bull trend. cryptocurrency market symbol.
Коллекция по умолчанию
Коллекция по умолчанию
Создать новую
Financial accounting of profit summary graphs analysis.
Коллекция по умолчанию
Коллекция по умолчанию
Создать новую
A 3D bar graph with data labels and percentage values displayed above each bar, providing a clear and informative business analysis
Коллекция по умолчанию
Коллекция по умолчанию
Создать новую
Legion-Media
Создайте свои проекты на основе качественных стоковых фотографий и видео.


Copyright © Legion-Media.